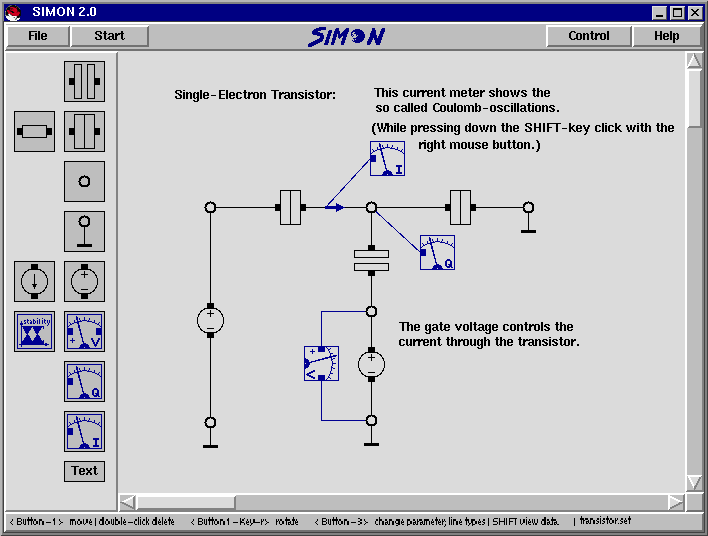
The following picture shows the main window of SIMON. On the
left side is the tool box, where one can choose various elements
for ones circuit. On the top is the menu bar, and on the bottom
is a help line which displays possible mouse button operations
and the name of the current circuit file. The main area of this
window is dedicated to the graphical editor, which allows easy
drag and drop assembly of single-electron circuits. From there
one can also launch the built in graphical postprocessor which
displays simulation results (see next picture).
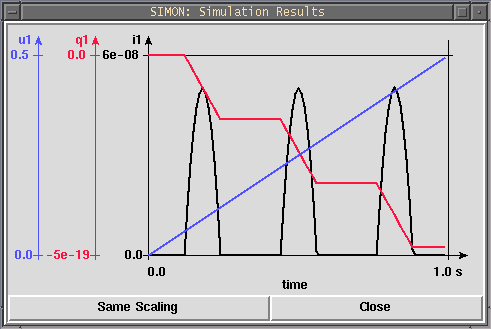
This is a window of the graphical post processor. It allows
to display several graphs with different y-axis. It is also possible
to have more than one graph windows of different circuit files
visible.
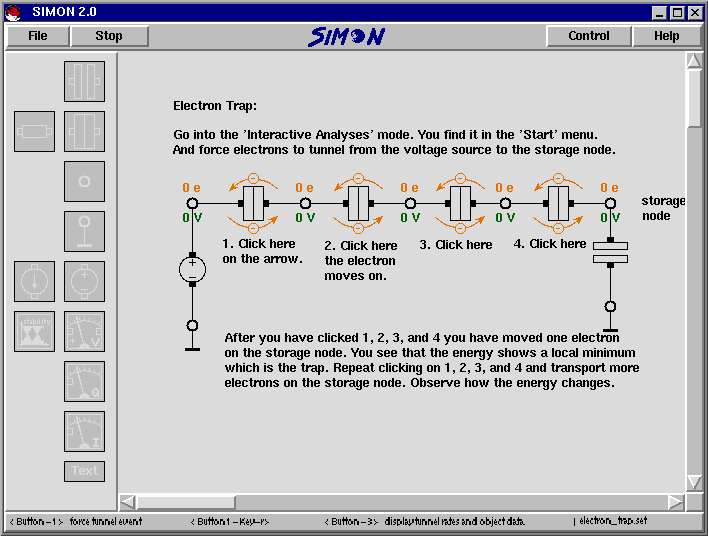
The next picture shows a screen shot of SIMON in the interactive
mode. Charges and voltages of every node are updated dynamically.
Orange arrows mark possible tunnel events which one can activate
interactively with a simple mouse click. According to the tunnel
event one chose, charges and voltages change, and the history
of the system energy (see next picture) is displayed. This operation
mode is very usefull to study a single-electron circuit in detail.
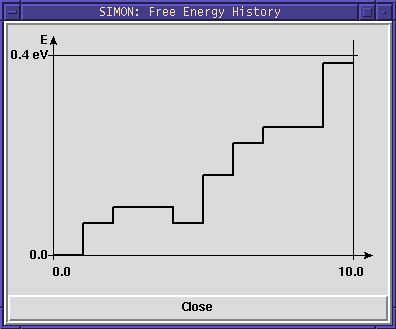
This is the history of the system energy, that is the free
energy of the whole circuit. In this example one can see a local
minimum which indicates a possible memory function of the electron
trap shown above.